NFT Appraisal
One of Atlas's goal is to create deeper liquidity for non-fungible assets.
And with the asset class of NFTs having significant historical incongruence in pricing between the buyers and sellers, we've provided an Appraisal chart to help bridge that incongruence and create liquidity.
NFT Appraisal (or Valuation) Chart
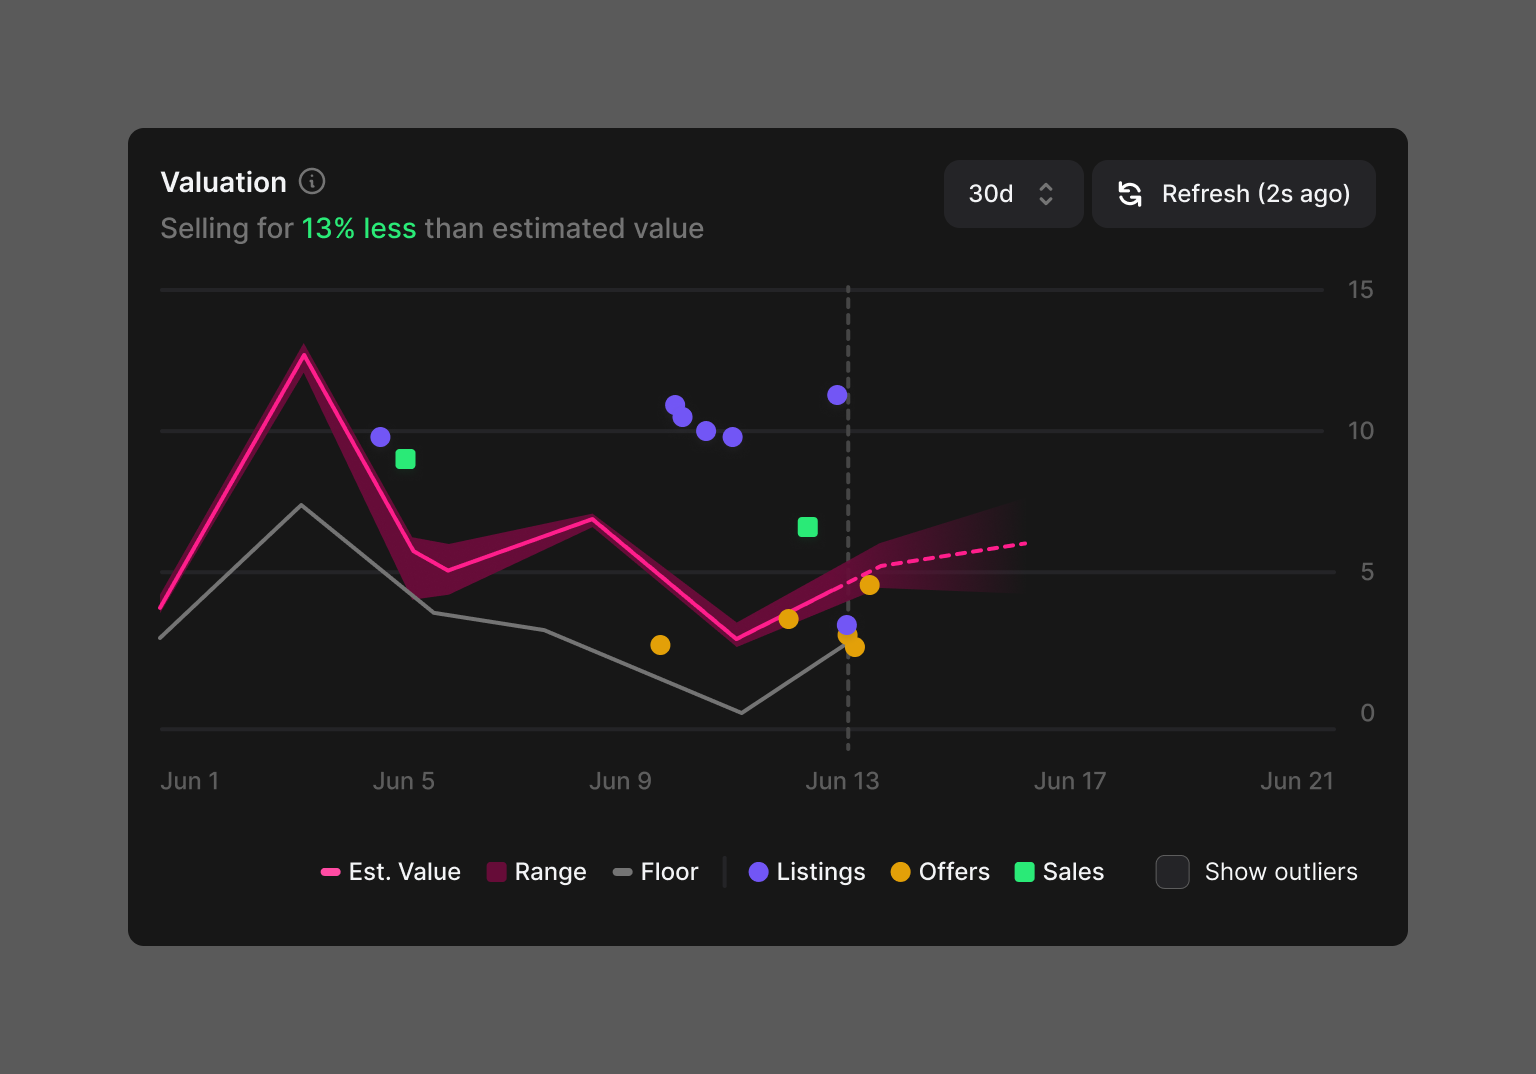
In order for us to appraise a token, our model has to take several factors into account. These factors are spread across the 5 different modalities, or types of data that we track at Atlas:
- Static: traits, total assets, etc.
- Market data: on- or off-chain listing data, offers, etc.
- On-chain data: transactions, mints, wallets, etc.
- Social data: Twitter accounts, Discord, community
- People: people behind the project, people who endorsed the project, etc.
Given the massive volume of data flowing in every second, we've decided to use neural networks, a type of machine learning model that mimics the way the human brain makes instantaneous decisions from large amounts of data.
The model for a particular token is retrained every time an event occurs that affects the token or a similar token in the collection. "Similar" can mean that they're related by traits or other factors.
However the NFT market is still volatile, seasonal, and just unpredictable beyond a certain point. No single "Appraisal" value can be truly accurate.
Hence why we want to be transparent about the level of confidence we have in our model's Appraisal predictions by displaying our Confidence and Likelihood chart.
Confidence and Likelihood Chart
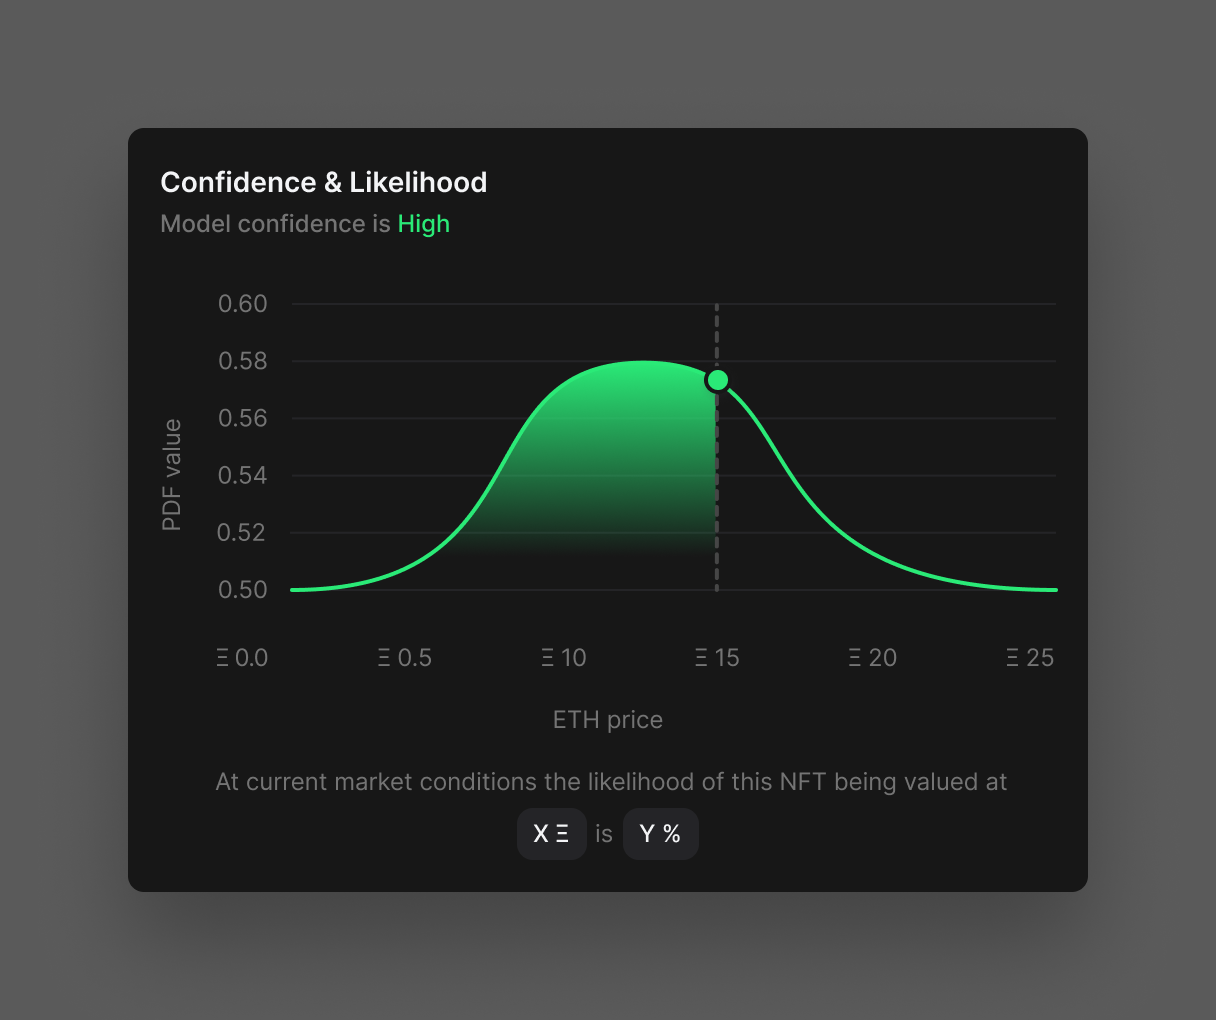
To put it simply, the above chart shows how confident our model is at different ETH values for a single token.
The graph is a PDF or Probability Density Function, where the area under the curve of the PDF sums to 1. This PDF represents the probability of the token's Appraised Value (i.e. the latest appraised value on the Valuation Chart).
The PDF below is an example of a token's PDF where our model is generally more confident that the chance of the token being just under 100 ETH is much higher than the chance of the token being well over 100 ETH or less than 50 ETH, for example.
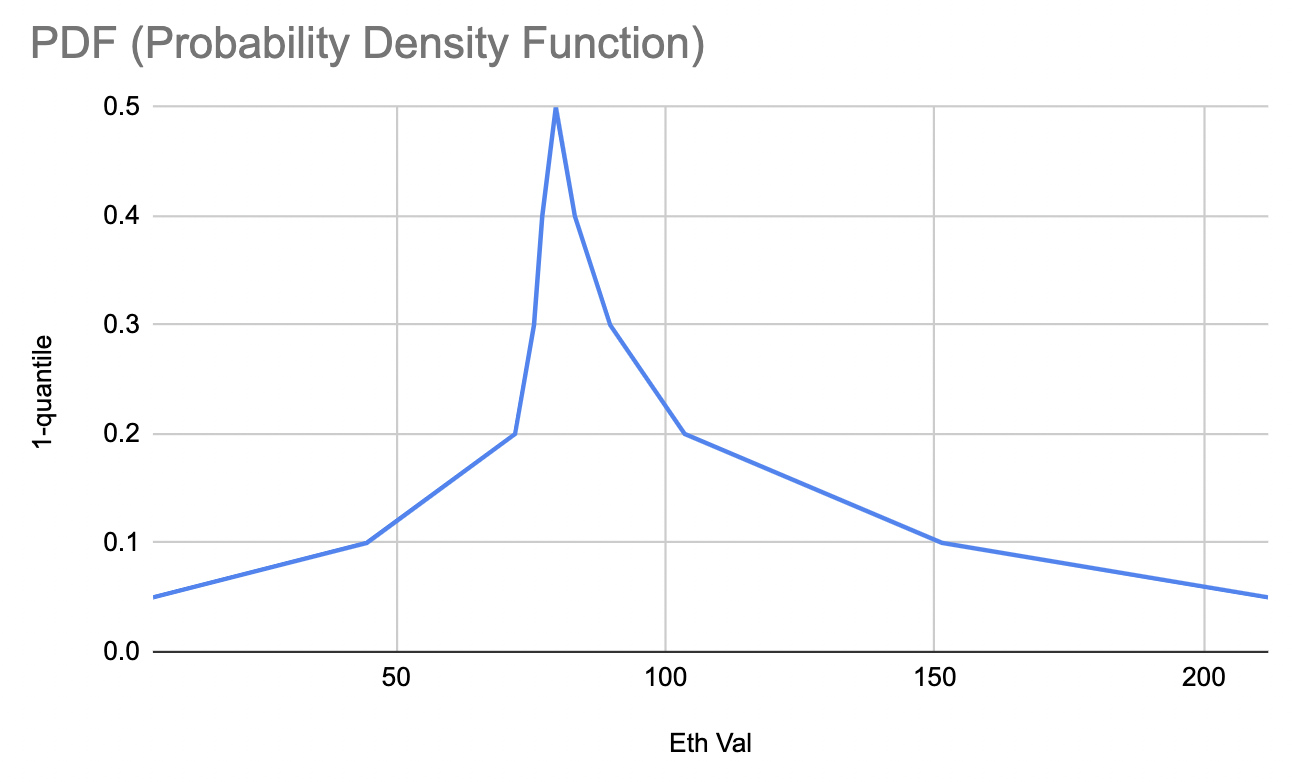
And yes, the Confidence and Likelihood chart's shape may not always be pretty :)
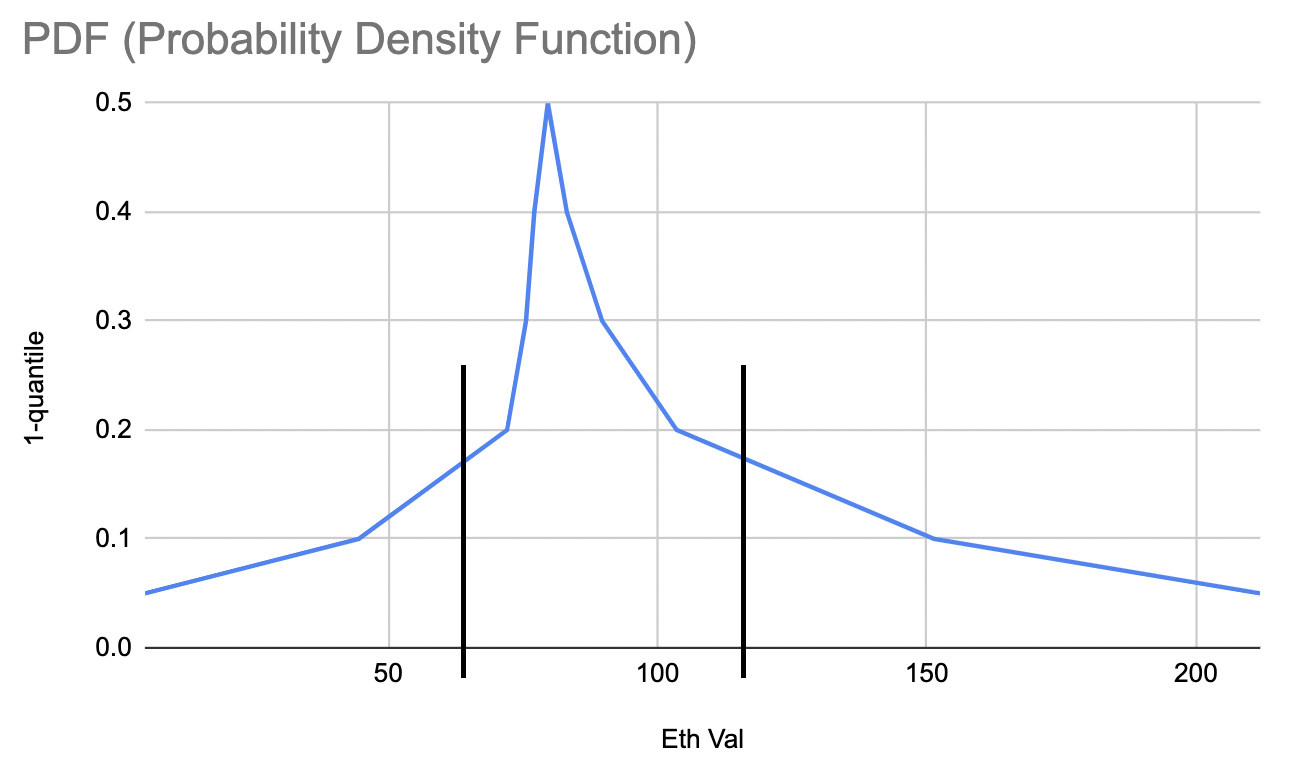
Another insight we can glean from the (below) PDF is that there's roughly a 50% likelihood of the token's appraisal value being between ~70 and ~105 ETH. If we recall the area under the blue line adding up to 1, we know that half of that area is within those two black lines.
Everything we've discussed on this page so far can be helpful if you're trying to understand what the token is currently worth. But pro traders are often looking to flip this token over a certain time horizon so they can profit and reinvest the funds into their future trades - which requires token liquidity.
Let's walk through how liquid this token would be for pro traders in our Liquidity & Risk Analysis section.
Appraisal Roadmap 👀
The following items are example areas that we're thinking about for the future of our Appraisal tech:
- An machine learning-based Portfolio Valuation
- Further model explainability and user education
- NFT appraisal ranges instead of a single value
- Sweeping that's machine learning-guided
- Possible partnerships with web3 startups to appraise assets!
Updated over 1 year ago